Web Service Commands
ApoPerion is the web API for Perion. It communicates in JSON, i.e., it receives information as JSON object and responds also with a JSON object.
In the following all available commands are listed.
/ (root)
Redirects to this documentation.
/version
Returns version information.
{
        "author": "Fabian Mueller",
        "last-modified": "2024-08-28T12:00:00.0",
        "name": "ApoPerion",
        "status": 200,
        "type": "web-service",
        "version": "0.5.0"
}
/new
Creates a new job and generates a token to reference it. Internally, dedicated storage space is allocated. The token is necessary for all further commands.
Returns a new job token.
{
        "token": "b2afc4dc-bf91-4899-8654-edc6f48f47ba"
}
/<token>/remove
Removes an existing job associated with the given token. Caution: removal cannot be undone!
Returns status 200 on success.
Returns status 500 if the occupied storage space cannot be freed.
{
        "status": 500,
        "message": "Unable to remove token <token>"
}
/list
Lists all active, i.e. available tokens and their creation/modification date.
Returns a list of tokens.
{
        "status": 200,
        "tokens":
        [
                {
                        "token": "b2afc4dc-bf91-4899-8654-edc6f48f47ba",
                        "date": "2024-08-28T16:17:23.0"
                },
                {
                        "token": "6c3e0883-31e3-452b-9b54-523e011049a2",
                        "date": "2024-07-11T10:38:18.0"
                }
        ]
}
/<token>/layout
Takes a JSON object sent via POST containing a 2D layout and constructs a 3D model from it. The model is the basis for all further simulations executed with the respective token.
Repeated execution of this command overwrites older data.
Returns status 200 on success.
Returns status 400 or 500 on failure. In case the service is unable to create a STL file by extruding the layout, make sure that there are at least three verticies definded for each obstacle in the layout and that the verticies are given counter-clockwise for each polygon.
/<token>/stl
Takes STL data sent via POST and stores them as 3D model. This overwrites an already existing model created by /<token>/layout. The data need to be sent in the multipart/form-data format. The element name (key) has to be “stl”.
Example using the command-line tool curl:
$ curl -F stl="@path/to/model.stl" 127.0.0.1:5000/<token>/stl
Example using Python’s requests module:
>>> import requests
>>> r = requests.post("127.0.0.1:5000/<token>/stl", files={"stl": "solid ..."})
Returns status 200 on success.
Returns status 400 if the token does not exist or if the STL data are missing.
/<token>/emitter
Takes a JSON object sent via POST containing either a list of emitter specifications or a GeoJSON feature collection defining the types, positions and directions of the warning devices to be simulated.
Returns status 200 on success.
Returns status 400 or 500 on failure.
Emitter specifications
The emitter specification is a list of ten floats. They describe the position vector, direction vector, width, height, opening angle and emitting intensity of the respective device.
[ posx, posy, posz, dirx, diry, dirz, width, height, angle, intensity ]
The position vector’s x and y components should be given in units of a coordinate reference system (e.g. EPSG 25833). The z component represents the altitude and should be given in meters over ground. The direction vector (the direction in which the warning device is pointing) the same coordinate system as for the position vector has to be used. Note, that this vector does not represent a point in space but a direction. So it can be normalized without losing its information. Width and height should be given in meters, the opening angle in degrees. The emitting intensity is interpredeted as emitting power per surface. For displays this corresponds to the luminance of the device measured in candela per square meter (cd/m2).
An arbitrary number of such specifications can be concatenated to a list and sent to ApoPerion.
[
        [ 166753.18178542712, 5944762.4046176495, 6.5, 0.084, 0.996, 0.0, 8.00, 3.50, 120.0, 300.0 ],
        [ 166436.08078542713, 5944822.4749571495, 3.0, -0.483, 0.876, 0.0, 3.70, 2.08, 160.0, 280.0 ],
        [ ... ]
]
Feature collection
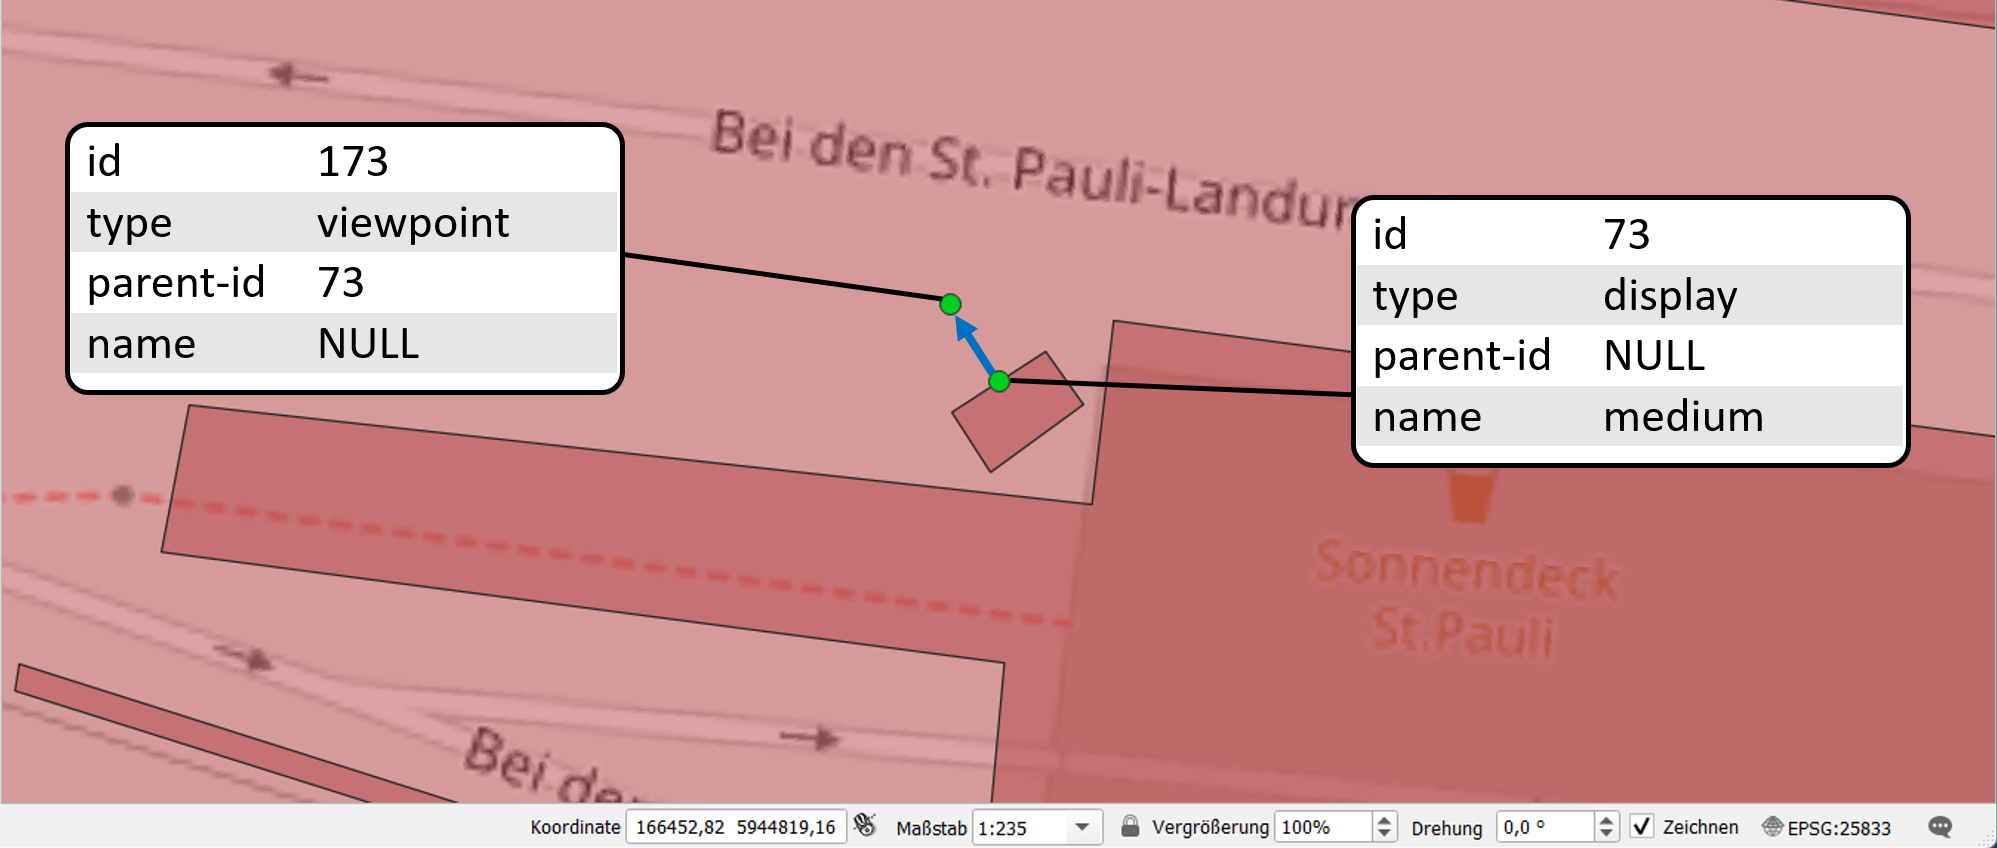
Alternatively, a GeoJSON feature collection can be used to provide warning device positions and properties. The colletion has to comprise two features of the type Point for each device: one to determine its position, the other to set the direction it is pointing to. The feature’s properties have to contain the four fields id (integer), type (string), parent-id (integer or NULL) and name (string or NULL). The feature collection itself can optionally contain a coordinate reference system (CRS) specification.
{
        "type": "FeatureCollection",
        "name": "warnmitel_landungsbruecken",
        "crs": { "type": "name", "properties": { "name": "urn:ogc:def:crs:OGC:1.3:CRS84" } },
        "features": [
                {
                        "type": "Feature",
                        "properties": {
                                "id": 73,
                                "type": "display",
                                "parent-id": null,
                                "name": "medium"
                        },
                        "geometry": {
                                "type": "Point",
                                "coordinates": [ 9.963968265147031, 53.546063439828423 ]
                        }
                },
                ...
                {
                        "type": "Feature",
                        "properties": {
                                "id": 173,
                                "type": "viewpoint",
                                "parent-id": 73,
                                "name": null
                        },
                        "geometry": {
                                "type": "Point",
                                "coordinates": [ 9.963940931108477, 53.546085621479939 ]
                        }
                },
                ...
        ]
}
IDs should be running integers. The ID of a viewpoint should reference to the ID of its corresponding device, e.g. viewpoint ID 173 references to device ID 73. However, this is not mandatory. The type string has to be either “display” or “viewpoint”. There may be further options in the future. While parent-id needs to be set for viewpoints, it can be omitted or set to NULL for device positions. The opposite holds true for the name field, which needs to be set for device positions but not for viewpoints. The parent ID is just the ID of the corresponding device. The value of the name field is used as selector to retrieve device properties such as dimensions, opening angle(s) and emitting intensity from the warning device data base.
GeoJSON feature collections as described above can easily be visualized and edited with a geographic information system, e.g. QGIS.
/<token>/run
Takes run parameters as JSON data sent via POST, prepares a Kalithea input file and executes the Kalithea binary as a separat process. The following list gives an overview of the run parameters. Fields marked with an asterisk (*) are mandatory. All others are optional.
"general"*objectHolding general information concerning the simulation. Comprises the following fields:
"generator"*"cpu"|"gpu"The generating device, either CPU or GPU based.
"threads"integerThe number of OpenMP threads when running in parallel on the CPU.
"type"*"visgrid"|"visrad"|"display"The kind of requested simulation algorithm. There are a grid-based and a ray-based visibility field algorithm, and the ray-based calculation of the warning device perceptibility.
"verbosity"integerTo increase or reduce the amount of printed output from Kalithea, increase or decrease this value. Zero means minimal output.
"scenario"objectHolding URLs to STL, DEM and/or emitter files. If given, those files do not have to be uploaded separately.
"city-model"URLURL to an STL file that should be used as city model.
"elevation-model":URLURL to an digital elevation model (DEM) file.
"emitter-file"URLURL to an GeoJSON file containing information about positions and directions of warning devices. See Emitter FeatureColletions and Warning devices.
"analysis"*objectHolding information about the selected analysis type (cf.
"general"/"type"). Comprises the following fields:"cell-width"*floatThe edge length (in meters) of the grid cells for the discretization of the analysed area.
"evaluation-height"*floatThe height (in meters) above ground at which the 2D visibility/audibility is evaluated, i.e., the eye level of the virtual observer.
"max-visibility"*floatOnly points within this distance are considered in the visibility analysis.
"angle-resolution"*floatNumber of rays that are sent out equally spaced from the center of each grid cell. The angle between them is 360°/angle-resolution. This field must only be given, if the calculation
"type"is"visrad"."boundaries"objectThe outer boundaries of the simulated area represented by at least three vertices. If this object is omitted, the boundaries are inferred from the STL model (taking its AABB). When using a layout as input, Perion reads the area boundaries automatically if the parameter
"perion"/"read-boundaries"is set totrue. If given, this object must contain:"vertX"*stringA vertex of the outer boundary polygon. X has to be an ascending integer. The value is a string containing the space separated components of a 2D- or 3D-vector, e.g.
"vert0":"0.0 0.0", "vert1":"50.0 0.0", "vert2":"50.0 30.0", "vert3":"30.0 0.0". Vertices of a polygon have to be given counter-clockwise.
"output"objectHolding information about the output formats and properties. Comprises the following fields:
"output-types"objectHolding the requested output formats and respective filenames. At least one has to be given. If
"blob"is not present, it will be added automatically. Since ApoPerion manages the names and locations of all files, a dummy string can be given as filename."png"filenameCreates a PNG image from the simulation results.
"vtk"filenameCreates a VTK file containing square planes representing the simulation grid cells. The planes’ colors corresponds to their perceptibility.
"blob"filenameCreates a binary large object (BLOB) containing all simulation grid information and results. A BLOB is always written, even if the whole
"output"block is omitted. It serves as the source for all plain text outputs.
"image-resolution"integerThe target pixel number of the PNG’s shorter edge. Defaults to 1000.
"perion"objectHolding additional information to control Perion (and not Kalithea). Comprises the following fields:
"read-boundaries"boolIf
true, the layout boundaries (total area) will be retrieved from the layout data. This feature is only available when a 2D layout is provided. Defaults tofalse."shift"listThe shift added to all outputted coordinates. It is automatically set to
[-x, -y]if"extrusion-at"is present in the 2D layout. Otherwise, it defaults to[0,0]. The shift has to be given in city model coordinates (see parameter below)."city-model-crs"str|intSets the coordinate reference system (CRS) of the city model. This information is required when the
"output_crs"parameter (see below) is used. If the city model is generated from a 2D layout, the parameter is set automatically."output_crs"str|intThe desired coordinate reference system (CRS) of all GeoJSON output. The value should be the EPSG code of the CRS, e.g. 4326 for WGS 84. If omitted, the same CRS as given under
"city-model-crs"is used. If both are omitted, the output gets an incomplete CRS entry."interpolate_to"str|floatThe desired cell width in the GeoJSON output. The value can be up to four times smaller than the actual cell with in the Kalithea calculation. Missing data is linearly interpolated. Also works to produce a coarser grid.
A paradigmatic JSON run parameter object could look like this:
{
        "general": {
                "generator": "cpu",
                "type": "visrad"
        },
        "analysis": {
                "cell-width": 1.0,
                "evaluation-height": 2.0,
                "max-visibility": 400.0,
                "angle-resolution": 360.0
        },
        "output": {
                "output-types": {
                        "png": "dummy.png"
                },
                "image-resolution": 1000.0
        },
        "perion": {
                "read-boundaries": true
        }
}
Returns status 200 on success.
Returns status 400 or 500 on failure.
/<token>/status
Returns the current status of the job associated with the token. The field "kalithea-status" can be either "not running" (before /<token>/run is called), "running", "finished", or "error". So far, "progress" is not continuously updated and only takes the value 0.0 (while running) and 100.0 (when finished). Command line outputs from Kalithea are stored in "stdout" and "stderr".
{
        "kalithea-status": "running",
        "progress": 0.0,
        "stdout": ["Creating Scenario","Creating Analysis",...],
        "stderr": []
}
As soon as the status of a job changes to "finished", its results can be queried.
Returns status 400 if the token does not exist.
/<token>/results
Returns the formated results of the successfully finished job. The output can be influenced with arguments sent via GET. The following list gives an overview of the arguments. Fields marked with an asterisk (*) are mandatory. All others are optional.
format*stringThe output format. The
stringmust be one of the following:idintegerThe ID of the emitter for which the result should be returned. If omitted, the results for all emitters will be returned.
Available Output Formats
Plain Text Formats
Perion can provide the calculation results in several formats that are intendet for further automated processing. Most usefull for visualization in a GIS are the flavours of GeoJSON. Mere numbers are available in CSV format.
geojson
The result is formatted as a FeatureCollection containing ten polygon Features each being the union of grid cells with approximately the same perceptibility value. The original cell size is given as "resolution". Each feature has a properties object containing its perceptibility value ("visibility"/"audibility") and a corresponding "color" for a heatmap representation.
{
        "type": "FeatureCollection",
        "crs": { "type": "name", "properties": { "name": "urn:ogc:def:crs:EPSG::4326" } },
        "id": 0,
        "name": "",
        "resolution": 5.0,
        "features": [
                {
                        "type": "Feature",
                        "properties": {
                                "color": [0.0, 0.0, 241.0, 255.0],
                                "visibility": 0.1
                        },
                        "geometry": {
                                "type": "MultiPolygon",
                                "coordinates": [
                                        [
                                                [
                                                        [13.388001396,52.511013161],
                                                        [13.388000299,52.51104312],
                                                        [13.387999204,52.511073037],
                                                        ...
                                                ]
                                        ]
                                ]
                        }
                },
                ...
        ]
}
Importing this format in a GIS gives a visualization comparable to this.
geojson-grid
The result is formatted as a FeatureCollection containing a square polygon Feature for each grid cell. This means the resulting files are much larger than the one generated with the geojson format.
{
        "type": "FeatureCollection",
        "crs": { "type": "name", "properties": { "name": "urn:ogc:def:crs:EPSG::4326" } },
        "resolution": 5.0,
        "features": [
                {
                        "type": "Feature",
                        "properties": {
                                "visibility": 0.5105152227657035
                        },
                        "geometry": {
                                "type": "Polygon",
                                "coordinates": [
                                        [
                                                [13.389694831, 52.510377608],
                                                [13.389842119, 52.510379613],
                                                [13.389838834, 52.510469479],
                                                [13.389691545, 52.510467474],
                                                [13.389694831, 52.510377608]
                                        ]
                                ]
                        }
                },
                ...
        ]
}
Importing this format in a GIS gives a visualization comparable to this.
geojson-abm
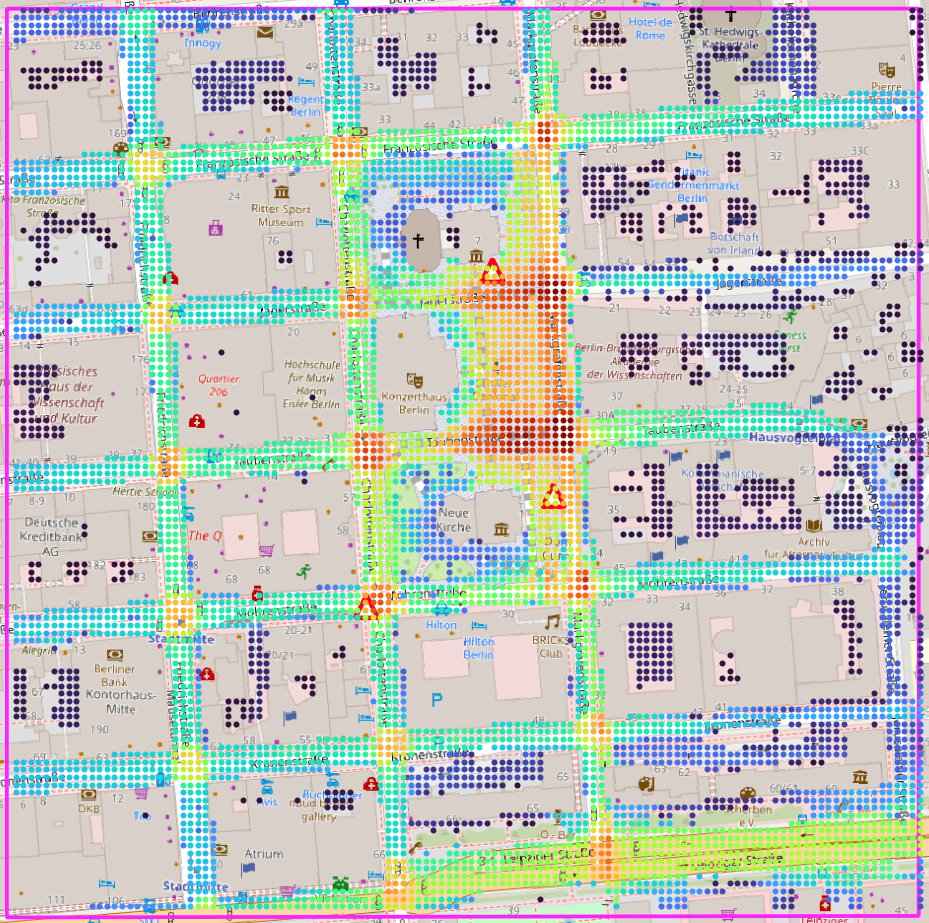
The result is formatted as a FeatureCollection containing a multipoint Feature for each grid cell. While reducing the amount of data that needs to be saved, the spacial extend of each cell is lost. Hence, the format is of limited use for direct visualization. However, it can be used to construct density maps or the like. Note that the visibility/audibility value is always given by the key "perceptibility".
{
        "type": "FeatureCollection",
        "crs": { "type": "name", "properties": { "name": "urn:ogc:def:crs:EPSG::4326" } },
        "features": [
                {
                        "type": "Feature",
                        "properties": {
                                "perceptibility": 1.0
                        },
                        "geometry": {
                                "type": "MultiPoint",
                                "coordinates": [ [ 13.313988151, 52.526423946 ] ]
                        }
                },
                {
                        "type": "Feature",
                        "properties": {
                                "perceptibility": 0.9924600016021673
                        },
                        "geometry": {
                                "type": "MultiPoint",
                                "coordinates": [ [ 13.313989624, 52.526423967 ] ]
                        }
                },
                {
                        "type":"Feature",
                        "properties": {
                                "perceptibility": 0.9858497481212468
                        },
                        "geometry": {
                                "type": "MultiPoint",
                                "coordinates": [ [ 13.313991098, 52.526423988 ] ]
                        }
                },
                ...
        ]
}
Importing this format in a GIS gives a visualization comparable to this.
csv
tbd
Kalithea Output Types
Depending on the given run parameters, Kalithea directly produces formated outputs that can be queried by ApoPerion.
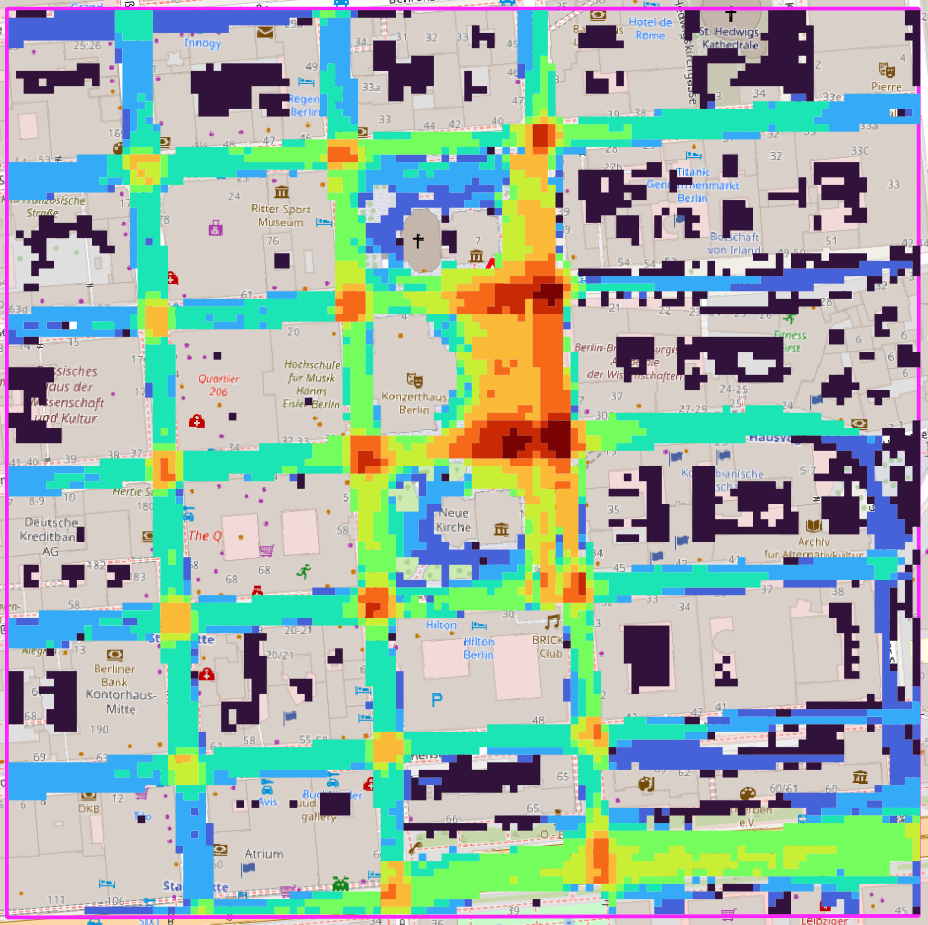
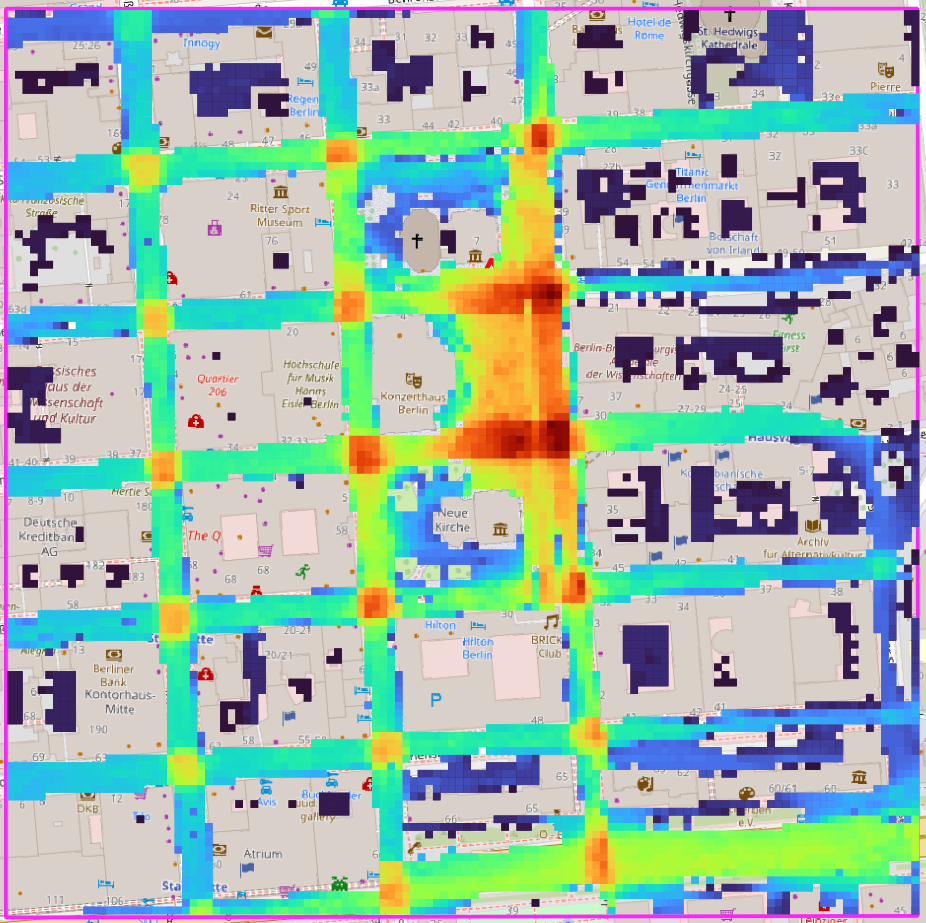
PNG (Pixel Image)
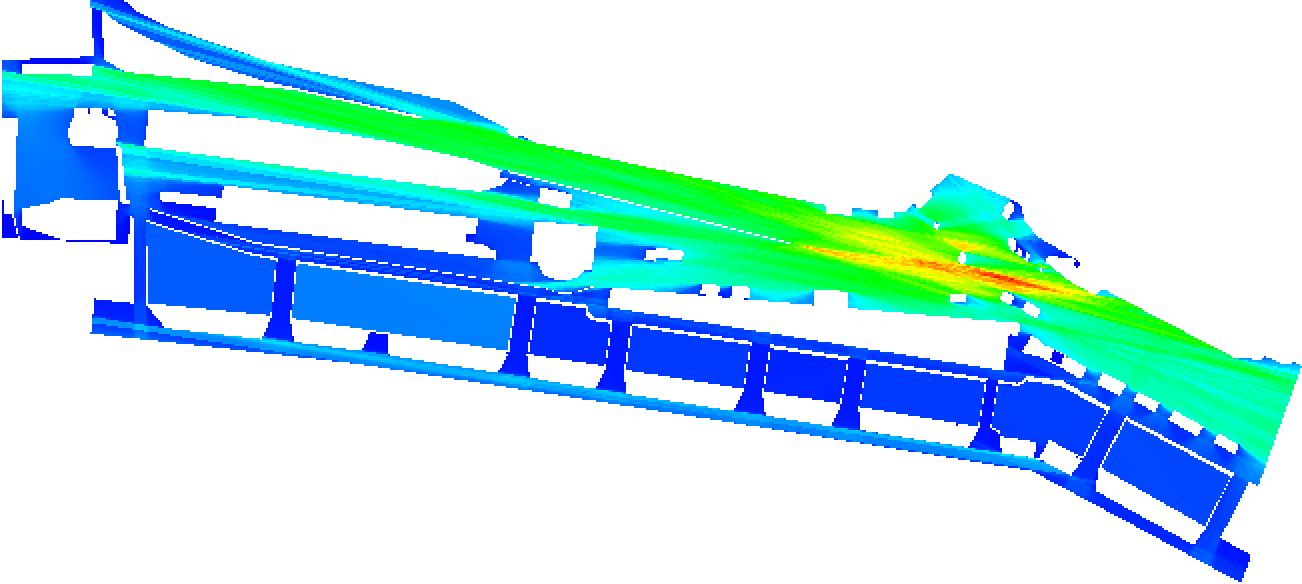
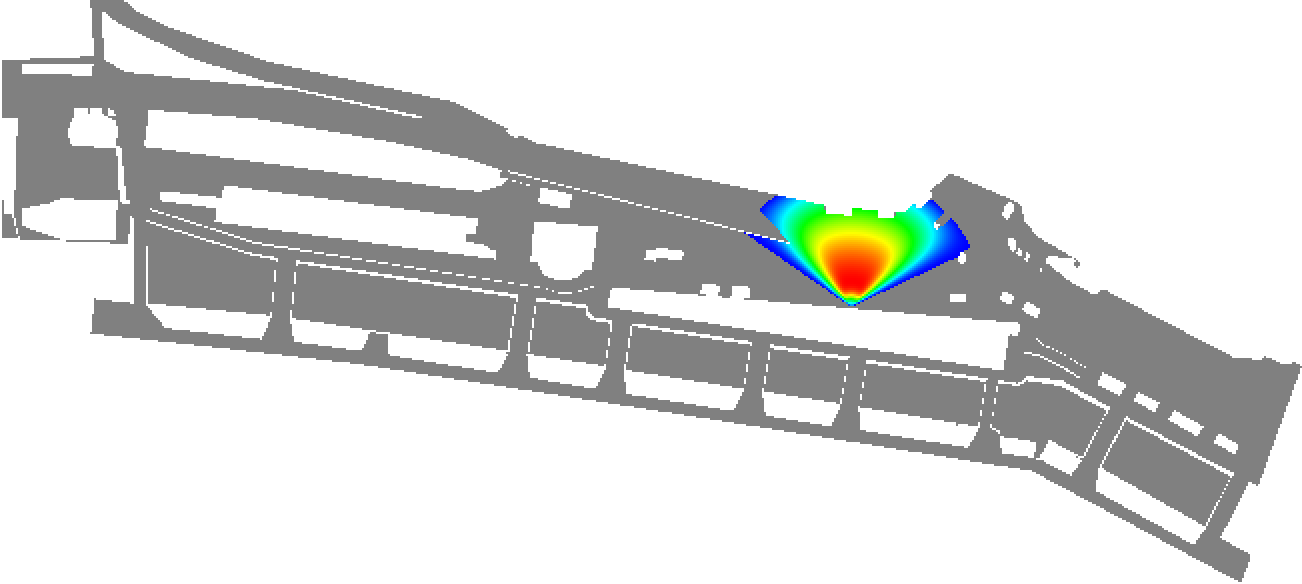
A pixel image where each visible cell of the simulation grid is represented by a colored square. The color corresponds to the normalized perceptibility score with blue (#0000FF) standing for the lowest and red (#FF0000) for the highest value. Invisible cells result in transparent squares. The area of the Port of Hamburg’s piers is shown as an example below.
Visibility field of the whole area:
Perceptibility of a certain display:
VTK (3D Model)
# vtk DataFile Version 3.0
Visibility | Tile (0,0,z) is centered at (385617.79452713, 5820925.81963869, z)
ASCII
DATASET POLYDATA
POINTS 21125 float
0.00 0.00 1.70
0.10 0.00 1.70
0.20 0.00 1.70
0.30 0.00 1.70
...
12.30 16.80 1.70
12.40 16.80 1.70
POLYGONS 10957 54785
4 1409 1410 1535 1534
4 1410 1411 1536 1535
4 1411 1412 1537 1536
4 1412 1413 1538 1537
...
4 19707 19708 19833 19832
4 19708 19709 19834 19833
CELL_DATA 10957
SCALARS Visibility float
LOOKUP_TABLE default
0
0.098
0.27
0.3
0.42
0.48
...
BLOB (Binary Large Object)
The binary output of Kalithea is most useful to gain fast access to the raw data of the calculation. It is automatically requested for every job by ApoPerion and, hence, can always be queried. The BLOB begins with a header of 48 bytes length. The frist half consists of three 8 byte unsigned long long values defining the grid dimensions in x and y direction, and the number of (used) cells in the grid. The latter is not necessarily the product of the former two but can be smaller. The reason is that only cells outside of obstacles but inside the layout boundaries are stored.
The second half is made up of three 8 byte doubles defining the cell width, and the x and y coordinate of the lower left cell of the grid.
After the header there is a sequence of 3-tuples consisting of two integers and one double. The integers define the row and column index of the cell in the grid, i.e., they take values between zero and the grid dimension in the respective direction. The double represents the calculated (non-normalized) perceptibility of the cell. There are as many tuples as there are (used) cells.
Represented as a text file, a BLOB could look like this:
200 140 14421
3.2 13.313988151 52.526423946
0 0 18017.1048223
0 1 18012.6894328
0 2 17936.4931194
...